India crossed two milestones in the last few years: it became one of the world’s largest internet populations, and it became one of the world’s cheapest places to be online. The first story is about access. The second story is about use. This article stays with the numbers of use.
The headline is simple: most Indian internet time is spent on entertainment, social media, and messaging. Education, work, and creation occupy a much smaller slice. The gap is not a technology gap. The devices and data plans are the same. The gap is one of default behavior and platform design.
Point C1 India’s digital-access success has produced a usage mix dominated by entertainment and social media, with education and production occupying a far smaller share of online time than the country’s demographic dividend requires.
The Access Story in One Paragraph
India had roughly 886 million internet users in 2024, according to the IAMAI-Kantar Internet in India Report 2024, and roughly 650 million smartphone users, per U.S. International Trade Administration estimates. Rural India is now driving growth. Data is cheap enough to be an afterthought for most households. The same report finds that 98% of users accessed content in Indic languages. By the old metrics, the digital divide is closing.
The policy story for the last decade was getting people online. That story worked. The next story is what people do once they are there.
The Daily Time Budget
Indians spent an estimated 1.1 trillion hours on smartphones in 2024, according to an EY industry report drawing on Sensor Tower data—roughly five hours per person per day if spread across the smartphone-user base. The share of that time devoted to entertainment, social media, and gaming dwarfs the share devoted to education or work-related tasks.
The National Council of Applied Economic Research’s India Human Development Survey Wave 3, a large nationally representative survey with more than 212,000 respondents, found that 66% of internet usage is for entertainment, while only 16.1% is for education — a 4.1:1 entertainment-to-learning ratio. Point C2 The NSSO Time Use Survey 2024 adds a structural view: 93% of Indians aged 6 and above participate in mass media or leisure activities, and leisure time has risen about 15% since 2019. Point C5
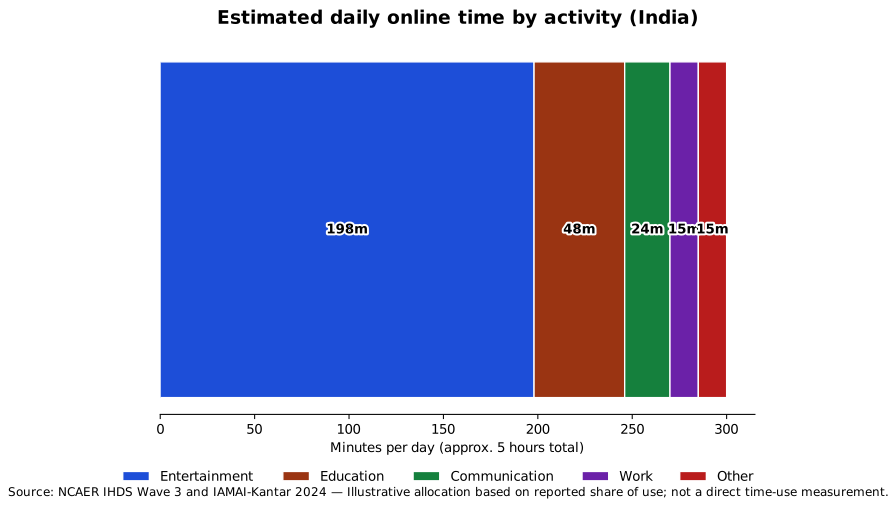
Source: NCAER IHDS Wave 3 and IAMAI-Kantar 2024; allocation is illustrative and based on reported shares of use, not a direct time-use measurement.
The chart above is an illustration, not a precise census of minutes. It translates reported shares of use into an approximate five-hour day. The exact minutes matter less than the shape: entertainment is the biggest block, education a small one, and work-related use smaller still.
The Student Version of the Same Gap
Among 14–16-year-olds, ASER 2024 found that 76% use smartphones for social media while 57% use them for education. Point C3 The overlap is not zero — the same device can be used for both — but the gap is the point. A device that could be a textbook, tutor, and workshop is more often a theater, casino, and gossip circle.
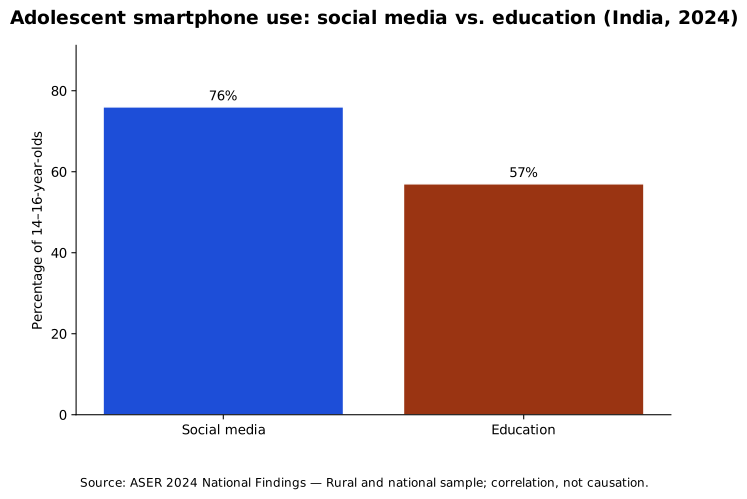
Source: ASER 2024 National Findings; rural and national sample of 14–16-year-olds; correlation, not causation.
Gen Z screen time is even starker: Indian and global estimates place adolescent and young-adult screen time at several hours per day, with one Indian review reporting 4–5 hours per day and a majority exceeding pediatric recommendations. A rural Indian study found that 83% of secondary-school children exceed the two-hour daily screen-time recommendation. Point C4
Entertainment Is Not the Enemy; Ratio Is
There is nothing wrong with entertainment. A society without leisure is not the goal. The problem is the ratio. Point C7 When entertainment and social media absorb the largest share of a young population’s digital attention, the opportunity cost falls on learning, skill-building, civic participation, and rest.
The media and entertainment sector reached roughly INR 2.78 trillion ($32.7 billion) in 2025, with digital media crossing INR 1 trillion for the first time, according to the FICCI-EY Media & Entertainment Report 2026. The sector’s growth is real. So is its appetite for time. The question is whether the country’s attention budget is being spent in proportion to its long-term goals.
Rural, Urban, and Language
The usage mix is not uniform. Urban users spend more time on streaming and gaming; rural users spend more time on short-form video and messaging. But the broad pattern — entertainment over education, consumption over creation — holds across regions.
The Indic-language internet deserves its own chapter (The Indic-Language Internet and the Vernacular Feed), but it matters here too. As data prices fell and Indic-language content expanded, the addressable user base multiplied. The same design patterns that maximize engagement in English and Hindi now operate in dozens of languages, often with even weaker local safety and quality signals.
The Opportunity Cost
Time is zero-sum. An hour spent in a feed is an hour not spent reading, practicing, resting, or talking. At scale, the aggregate hours run into the billions.
The digital economy contributes an estimated 11.74% of India’s GDP, or roughly $402 billion, according to ICRIER and the Economic Survey. That is a genuine achievement. But the same infrastructure produces a parallel cost: Gallup estimates $351 billion in annual losses from employee disengagement, with India’s engagement rate at 23% in 2025. Point C6 The two numbers should not be casually added or subtracted, but they cannot be read separately either. One measures value created; the other measures attention misdirected.
What This Article Does Not Claim
This article does not claim that all screen time is harmful. Studies find that academic screen time can correlate positively with learning even when non-academic screen time correlates negatively. The issue is the 4:1 entertainment-to-education ratio, not the existence of entertainment.
It also does not claim that users are passive victims. People make choices. But those choices are shaped by defaults, recommendations, autoplay, and incentives designed by platforms. Understanding the numbers is the first step toward changing the defaults.
Sources and Method
This article draws on government surveys (NSSO Time Use Survey 2024), a large academic survey (NCAER India Human Development Survey Wave 3), an education survey (ASER 2024), and industry reports (IAMAI-Kantar Internet in India Report 2024, U.S. International Trade Administration, EY/Sensor Tower, FICCI-EY Media & Entertainment Report 2026, Gallup State of the Global Workplace 2025). Where figures are estimates or global benchmarks applied to India, the text says so.
Open Questions
- How much of the entertainment-to-education ratio is driven by age, income, or language, and how much by platform design?
- Has the ratio changed since the pandemic-induced surge in screen time?
- What would it take for educational and productive uses to gain even a few percentage points of daily time?
- How should policymakers and educators interpret the difference between access and use?
Related in This Series
- The Attention Extraction — the overview and thesis of the diagnosis.
- The Student Screen — a deeper look at education vs. entertainment among teenagers.
- The Engagement Gap — how the usage mix shows up in workplaces.
- The Indic-Language Internet and the Vernacular Feed — why language expansion changed the scale and shape of extraction.
- Attention, Substance, and the AI Moment — the full series guide and reading paths.
Article guideImportant points and sources7 pointsShow guideHide guide
- C001core · high · verifiedIndia's digital-access success has produced a usage mix dominated by entertainment and social media, with education and production occupying a far smaller share of online time than the country's demographic dividend requires.
- C002core · high · verifiedThe NCAER India Human Development Survey Wave 3 found that roughly two-thirds of reported internet use is for entertainment while only about one-sixth is for education, a ratio of roughly 4:1.
- C003core · high · verifiedASER 2024 reports that 76% of 14–16-year-olds use smartphones for social media while 57% use them for education.
- C004landscape · medium · verifiedIndian adolescents and young adults are estimated to spend several hours per day on screens, with a large majority exceeding the two-hour daily screen-time recommendation.
- C005landscape · high · verifiedThe NSSO Time Use Survey 2024 shows that 93% of Indians aged 6 and above participate in mass media or leisure activities, and leisure time has risen about 15% since 2019.
- C006landscape · medium-high · verifiedGallup data places India's employee engagement at 23% and estimates roughly $351 billion in annual losses from disengagement, illustrating the economic opportunity cost of attention fragmentation.
- C007core · medium-high · verifiedEntertainment is not the problem; the problem is the ratio of entertainment to education, production, and rest, and the opportunity cost that ratio imposes.
SourcesSources used12 sourcesShow sourcesHide sources
- PIB: Economic Survey 2025-26 — Public Health, Digital Addiction and Mental Health (Release ID 2219931, 29 Jan 2026)government-press-release
- NCAER: The Evolving Landscape of Digital Inclusion in India (IHDS Wave 3)research-report
- IAMAI-Kantar: Internet in India Report 2024industry-report
- ASER 2024 National Findingsresearch-report
- NSSO Time Use Survey 2024 Factsheetgovernment-report
- EY: India’s media and entertainment sector grew 9% to INR2.78 trillion in 2025industry-report
- U.S. International Trade Administration: India Digital Economygovernment-report
- EY: A Studio Called India / Sensor Tower (hours spent on phones)industry-report
- International Journal of Indian Psychology: Impact of Digital Screen Time on Adolescentspeer-reviewed-study
- PMC: Prevalence of excess screen time among secondary school children in rural Indiapeer-reviewed-study
- Gallup State of the Global Workplace: India Country-Level Dataindustry-report
- MeitY/ICRIER: Estimation and Measurement of India's Digital Economygovernment-report
Look closer
Sources and notes
Open detailsClose details
Look closer
Sources and notes
These notes collect the sources, counterpoints, and review status behind the article's important points. Read the essay first; open this when you want to check something.
Confidence reflects how strongly the sources support the point (low / medium / high). Status describes the point's role (e.g., core, argument, landscape). Sources link to supporting material;counterpoints note boundary conditions or conflicting findings.
India's digital-access success has produced a usage mix dominated by entertainment and social media, with education and production occupying a far smaller share of online time than the country's demographic dividend requires.
verifiedreviewed 2026-07-18
- Sources (2)
“NCAER IHDS Wave 3 finds that roughly two-thirds of reported internet use is for entertainment while about one-sixth is for education.”
NCAER: The Evolving Landscape of Digital Inclusion in India (IHDS Wave 3)direct“The Internet in India Report 2024 documents near-ubiquitous access and a usage mix dominated by entertainment, social media, and messaging.”
IAMAI-Kantar: Internet in India Report 2024direct
- Counterpoints (1)
The same platforms are also used for peer learning, exam groups, and informal skill discovery, so the boundary between social and educational use is fuzzy.
The NCAER India Human Development Survey Wave 3 found that roughly two-thirds of reported internet use is for entertainment while only about one-sixth is for education, a ratio of roughly 4:1.
verifiedreviewed 2026-07-18
- Sources (1)
“66% of internet usage is for entertainment; 16.1% is for education or online courses/classes.”
NCAER: The Evolving Landscape of Digital Inclusion in India (IHDS Wave 3)direct
- Counterpoints (1)
Reported shares reflect respondent self-classification and may not map cleanly onto actual minutes; multi-purpose use can be classified differently by different users.
ASER 2024 reports that 76% of 14–16-year-olds use smartphones for social media while 57% use them for education.
verifiedreviewed 2026-07-18
- Sources (1)
“Among 14–16-year-olds, 76% use smartphones for social media while 57% use them for education.”
ASER 2024 National Findingsdirect
- Counterpoints (1)
The same device can be used for both social and educational purposes, and the survey does not measure time spent or learning outcomes.
Indian adolescents and young adults are estimated to spend several hours per day on screens, with a large majority exceeding the two-hour daily screen-time recommendation.
verifiedreviewed 2026-07-18
- Sources (2)
“A review of Indian adolescent screen-time studies reports averages of 4–5 hours per day across devices and activities.”
International Journal of Indian Psychology: Impact of Digital Screen Time on Adolescentsdirect“A rural Indian study found that 83.2% of secondary school children spent more than the recommended two hours per day on screen devices.”
PMC: Prevalence of excess screen time among secondary school children in rural Indiadirect
- Counterpoints (1)
Screen-time figures vary widely by age, region, income, and measurement method; no single nationally representative census exists.
The NSSO Time Use Survey 2024 shows that 93% of Indians aged 6 and above participate in mass media or leisure activities, and leisure time has risen about 15% since 2019.
verifiedreviewed 2026-07-18
- Sources (1)
“93% of Indians aged 6 and above participate in mass media or leisure activities; leisure time has risen about 15% since 2019.”
NSSO Time Use Survey 2024 Factsheetdirect
- Counterpoints (1)
The survey captures activity participation, not platform-specific attention or quality of leisure.
Gallup data places India's employee engagement at 23% and estimates roughly $351 billion in annual losses from disengagement, illustrating the economic opportunity cost of attention fragmentation.
verifiedreviewed 2026-07-18
- Sources (1)
“Gallup State of the Global Workplace 2025 places India's employee engagement at 23% and estimates $351 billion in annual losses from disengagement.”
Gallup State of the Global Workplace: India Country-Level Datadirect
- Counterpoints (1)
Engagement is shaped by wages, job quality, management, and macroeconomic conditions, not only by digital distraction.
Entertainment is not the problem; the problem is the ratio of entertainment to education, production, and rest, and the opportunity cost that ratio imposes.
verifiedreviewed 2026-07-18
- Sources (2)
“The large entertainment-to-education usage ratio implies an opportunity cost for learning and skill-building time.”
NCAER: The Evolving Landscape of Digital Inclusion in India (IHDS Wave 3)indirect“India's digital economy contributes 11.74% of GDP, while Gallup estimates large disengagement losses, showing that the same infrastructure creates value and opportunity cost simultaneously.”
MeitY/ICRIER: Estimation and Measurement of India's Digital Economyindirect
- Counterpoints (1)
Leisure and entertainment have legitimate social and psychological roles; the concern is proportion, not elimination.
Review recordHow this was madeShow detailsHide details
Created 2026-07-05 by human. Policy: policy:default v1.0.0.
Researched, drafted, and structured with AI agents; approved for publication by a human reviewer.
✓ Approved hash matches current article
Reviews
- humanapproved2026-07-05
Scope: thesis, claims, tone, privacy, sources
contentHash:
fcf6ac5f114e1e55…Human author approved publication.
- humanapproved2026-07-18
Scope: article
contentHash:
77c6dfac33885a82…Re-approved by maintainer after the meta#61 P2 series migration (hardcoded kicker strip + arc reorder; no prose change beyond the kicker line; issue #124 instruction).
Machine-readable files
The same points, sources, and relationships are also available as structured files for agents and tools. The JSON follows thepublication record schema.